contentTracing
Chromium からトレースデータを収集して、パフォーマンスのボトルネックや遅い操作を見つけます。
プロセス: メイン
このモジュールにはウェブインターフェイスが付属していません。 記録したトレースを見るには、トレースビュアー を使用します。Chrome では chrome://tracing で利用できます。
[!NOTE] app モジュールの
readyイベントが発生するまではこのモジュールを使用してはいけません。
const { app, contentTracing } = require('electron')

app.whenReady().then(() => {
  (async () => {
    await contentTracing.startRecording({
      included_categories: ['*']
    })
    console.log('Tracing started')
    await new Promise(resolve => setTimeout(resolve, 5000))
    const path = await contentTracing.stopRecording()
    console.log('Tracing data recorded to ' + path)
  })()
})
メソッド
contentTracing モジュールには以下のメソッドがあります。
contentTracing.getCategories()
History
| Version(s) | Changes |
|---|---|
None | This method now returns a Promise instead of using a callback function. |
戻り値 Promise<string[]> - すべての子プロセスが getCategories リクエストを受諾したとき、そのカテゴリグループの配列で解決されます。
カテゴリグループの集合を取得します。 新しいコードパスに到達したら、カテゴリグループは変更できます。 組み込みのトレースカテゴリのリスト もご参照ください。
注意: Electron は
"electron"という非デフォルトのトレースカテゴリを追加します。 このカテゴリは、Electron 固有のトレースイベントのキャプチャに使用できます。
contentTracing.startRecording(options)
History
| Version(s) | Changes |
|---|---|
None | The |
None | This function now returns a callback |
戻り値 Promise<void> - すべての子プロセスが startRecording リクエストを受諾したときに解決されます。
すべてのプロセスで記録を開始します。
EnableRecordingリクエストを受信するとすぐにローカルでは即時、子プロセスでは非同期的に記録が開始されます。
記録を実行中の場合、promise はすぐに解決されます。一度に一つまでしかトレース操作は処理されません。
contentTracing.stopRecording([resultFilePath])
History
| Version(s) | Changes |
|---|---|
None | This method now returns a Promise instead of using a callback function. |
None | The |
resultFilePathstring (任意)
戻り値 Promise<string> - すべての子プロセスが stopRecording リクエストを確認すると、トレースデータを格納したファイルへのパスで解決します
すべてのプロセスで記録を停止します。
子プロセスは、大抵、トレースデータをキャッシュし、滅多に書き出さず、メインプロセスにトレースデータを送り返すだけです。 トレースデータをIPC越しに送信するのは高負荷な操作であるため、これはトレースのランタイムオーバーヘッドを最小化するのに役立ちます。 そのため、トレースを終了するために、Chromium はすべての子プロセスに保留中のトレースデータをフラッシュするよう非同期に要求します。
トレースデータは resultFilePath へと書き込まれます。 resultFilePath が空であるか提供されていない場合、トレースデータは一時ファイルに書き込まれ、そのパスは promise で返されます。
contentTracing.getTraceBufferUsage()
History
| Version(s) | Changes |
|---|---|
None | This method now returns a Promise instead of using a callback function. |
戻り値 Promise<Object> - トレースバッファの最大使用率の value と percentage を含むオブジェクトで実行されます。
valuenumberpercentagenumber
完全な形式のパーセンテージとして、トレースバッファのプロセス間の最大使用率を取得します。
contentTracing.enableHeapProfiling([options]) 実験的
History
| Version(s) | Changes |
|---|---|
None | API ADDED |
Returns Promise<void> - Resolves once heap profiling has been enabled.
Enable heap profiling for MemoryInfra traces. Equivalent to the --memlog switch in Chrome.
Only takes effect if the disabled-by-default-memory-infra category is included.
Needs to be called before contentTracing.startRecording().
使い方:
const { contentTracing } = require('electron')

async function recordTrace () {
  await contentTracing.enableHeapProfiling()
  await contentTracing.startRecording({
    included_categories: ['disabled-by-default-memory-infra'],
    excluded_categories: ['*'],
    memory_dump_config: {
      triggers: [
        { mode: 'detailed', periodic_interval_ms: 1000 }
      ]
    }
  })

  await new Promise(resolve => setTimeout(resolve, 5000))

  const filePath = await contentTracing.stopRecording()
}
To view the recorded heap dumps:
-
Download the breakpad symbols for your Electron version from the Electron GitHub releases
-
Clone the Electron source code
-
In your Chromium checkout for Electron, run this command to symbolicate the heap dump:
python3 third_party/catapult/tracing/bin/symbolize_trace --use-breakpad-symbols --breakpad-symbols-directory /path/to/breakpad_symbols /path/to/trace.json -
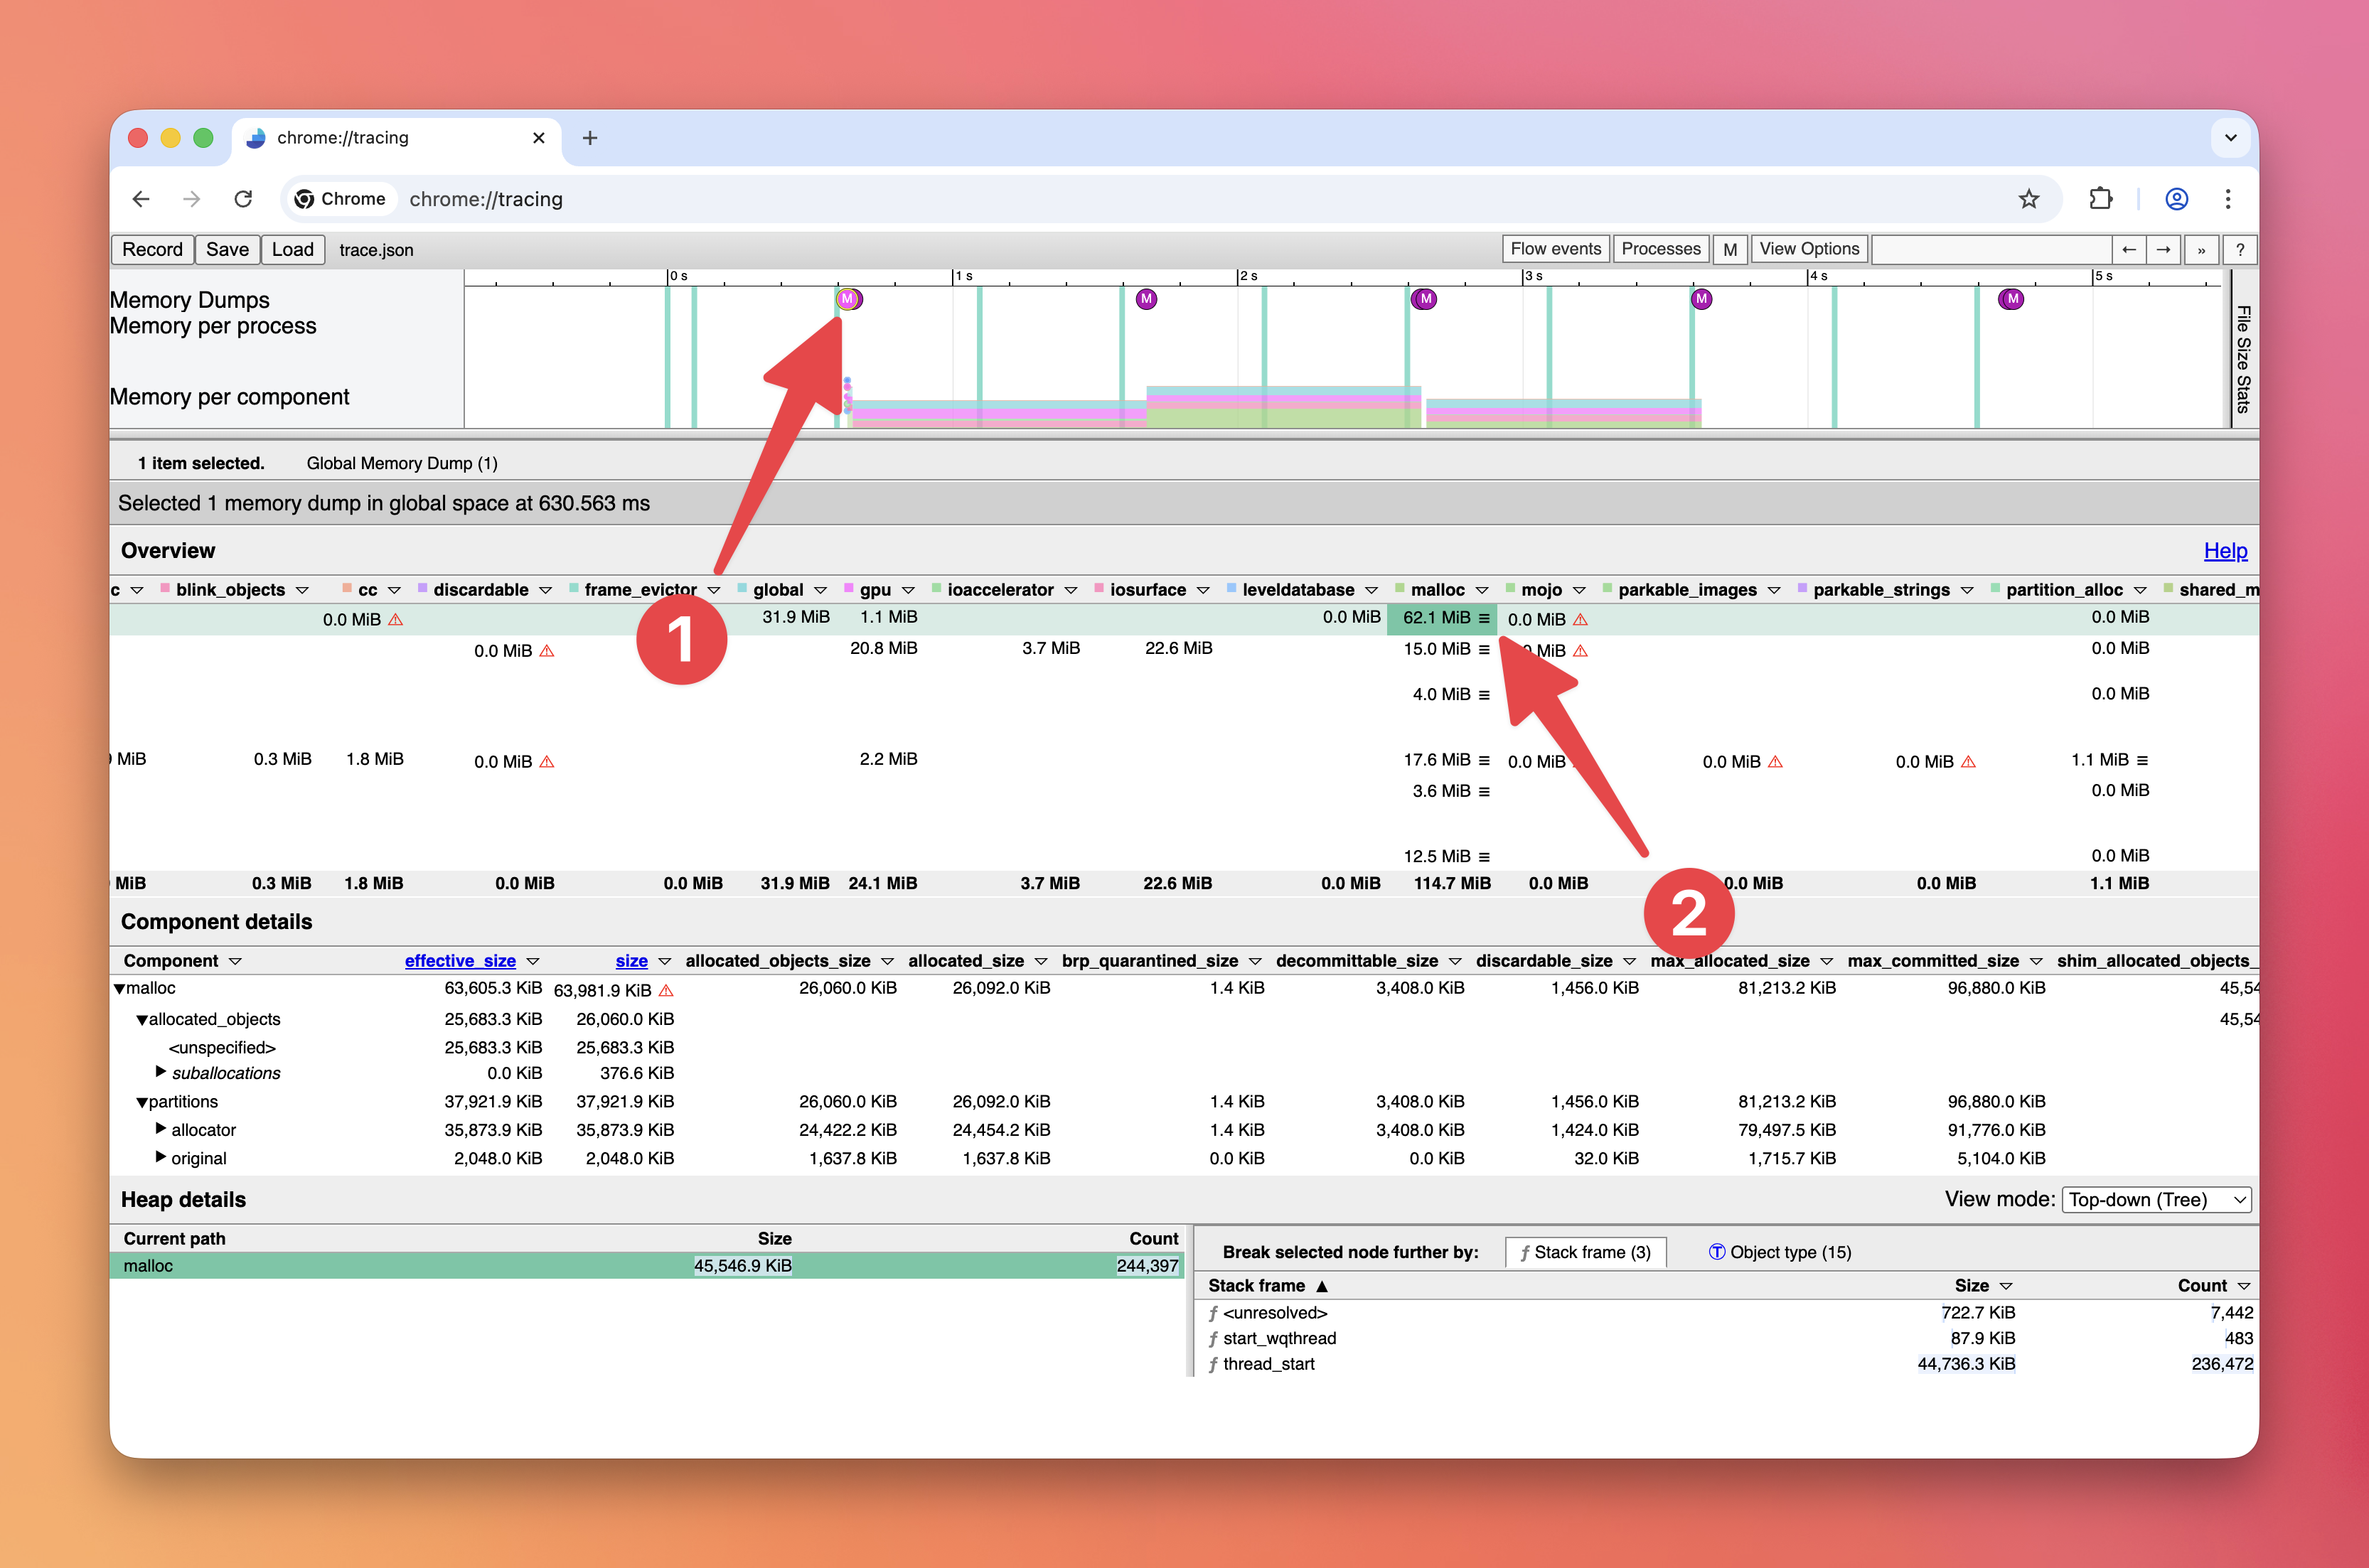
Open the symbolicated trace in
chrome://tracing(the Perfetto UI does not support memory dumps yet) -
Click on one of the
Msymbols -
Click on a
☰triple bar icon (e.g., in themalloccolumn)